|
Congratulations to the SESUG Data Visualization Competition Winners!
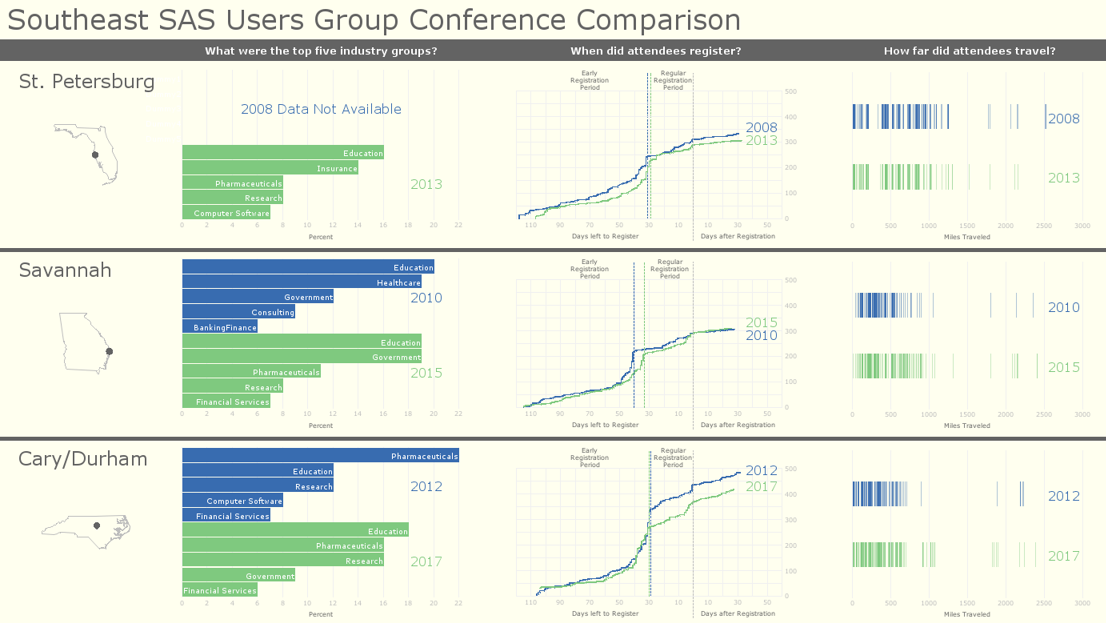
1st Place: Robert Allison (click to see the visualization)
2nd Place: Mira Shapiro (click to see the visualization)
3rd Place: Geoffrey Dean (click to see the visualization)
Click here to download the complete Data Visualization Competition details
The SESUG Data Visualization Competition rules are listed below:
- Competition is open to all SAS users.
- Participants must be registered to attend SESUG 2019 to be eligible for cash prizes; all other entrants will be eligible for recognition/placement only.
- Participants can submit a maximum of two entries.
- Results must use SAS or JMP or both.
- Results must use one of the provided datasets (see below).
- All visualization forms are eligible - we are looking for the best visualization of information using SAS or JMP software.
- Submitters must agree to inclusion of their entry in the SESUG proceedings, and if a winner, for SESUG promotional use.
- All code must be included with submission and be reproducible. Visual Analytics entries must include the session generated .xml.
- Submissions must be individual rather than group efforts.
- An outside judge with graphics expertise will be selected.
- Judging will be "entrant blind" to protect against unintentional bias.
- Judging criteria will score entries on creativity, clear presentation of information, and overall appearance.
- All visualization entries should be incorporated into a .PPTX and sent to
Barbara Okerson.
Be sure to separately include code and contact information with the submission.
- Entries must be received by EOD October 6th, 2019.
- Results will be announced and prizes awarded at SESUG opening session. All entries will be available for viewing throughout the conference.
Data sets for the competition are:
1. York County Indentured Servants 1718-1759
308 entries, 14 fields
Permission to use dataset received from Virtual Jamestown.
2. Humphrey Harwood Ledger B, Folios 1-102 (1773-1793)
Harwood was a bricklayer and builder
3346 entries, 53 fields with key
Permission to use dataset received from Colonial Williamsburg Foundation.
|